We will need:
- Thermistor itself, NTC, 10kOhm.
- Resistor, 10kOhm
- Arduino
- A reference thermometer, the readings from which are surely correct.
The setup is very common, so I will describe it briefly.
Standard Setup
 |
| NTC Thermistor Connection |
- As you can see, the thermistor should be connected to the high level; it's important for the calculation.
- A# - is any analog port of Arduino
The reference thermometer should be placed next to the thermistor.
Standard Calculation
Standard Steinhart–Hart equation to calculate temperature by the resistance:
 |
| Steinhart–Hart Equation |
Where:
- Rt - calculated resistance of the thermistor at the moment.
- Rs - nominal resistance of the series resistor.
- 1024 - Arduino ADC Conversion value (explained in the following section).
- analogValue - reading form the Arduino port. Important: if the thermistor is connected to the GND then use "analogValue = 1024 - analogValue" instead (see: https://asilichenko.blogspot.com/2024/07/arduino-1023-or-1024.html).
- 10k - nominal resistance of the thermistor at 25°C.
- B - the B (or β) of the thermistor.
- 25 - the temperature at which the resistance of the thermistor is equal to 10k.
- 273.15 - difference between the Celsius and Kelvin scales.
ADC Conversion Value
According to the section "23.7 ADC Conversion Result" from the datasheet: https://content.arduino.cc/assets/Atmel-7810-Automotive-Microcontrollers-ATmega328P_Datasheet.pdf
 |
| Arduino ADC Conversion Result |
This means that the range of voltages between GND and Vref is split into 1024 parts, where Vref corresponds to 1024, but due to the limit of 10 bits, it will become 1023.
 |
| Calculation of Rt based on ADC analog value and Rs |
Factors Affecting the Calculated Temperature
When you get the analog value reading and calculate the temperature, your result is affected by two variables:
- B-parameter of the thermistor.
- Resistance of the serial resistor, Rs.
B-parameter tilts the graph:
 |
| Dependence of the Calculated Temperature on the B Parameter |
Real resistance of the Rs shifts the graph:
 |
| Dependence of the Calculated Temperature on the Serial Resistance |
So, if the values of the B-parameter and series resistor are not precise, then your calculated temperature will be inaccurate.
Let's find out the real values and calibrate the calculation. We'll start by collecting data.
Collecting Data
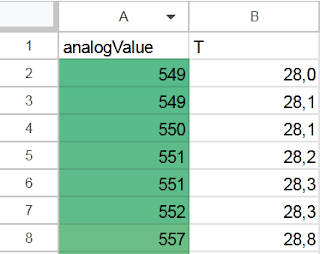
Collect a series of data at different temperatures (the more, the better): analogValue and actual temperature.
For example:
 |
| Collected data |
Put expected values of B-parameter and Rs into some separated cells, we will adjust the values later:
 |
| Parametrised columns |
Add calculated columns Rt and Tcalc:
 |
| Calculate columns Rt and Tcalc |
- Rt - `=D$2 * (1024 / A2 - 1)`
- Tcalc - `=1 / ( ln(E2 / 10000) / C$2 + 1 / (25 + 273,15) ) - 273,15`
Create a diagram with columns for analogValue, T, and Tcalc:
 |
| B = 3950, Rs = 10k |
Calibrating
Now, let's adjust our parameters to align these graphs.
We'll start with the B-parameter to correct the tilt. Adjust the B-parameter so that the graph becomes parallel to the graph of the actual data:
 |
| B = 3550, Rs = 10k |
Adjust the Rs so that the graph matches the graph of the actual data:
 |
| B = 3550, Rs = 10.3k |


No comments:
Post a Comment